Starting point
-
Your computer is connected to the installation.
Procedure
-
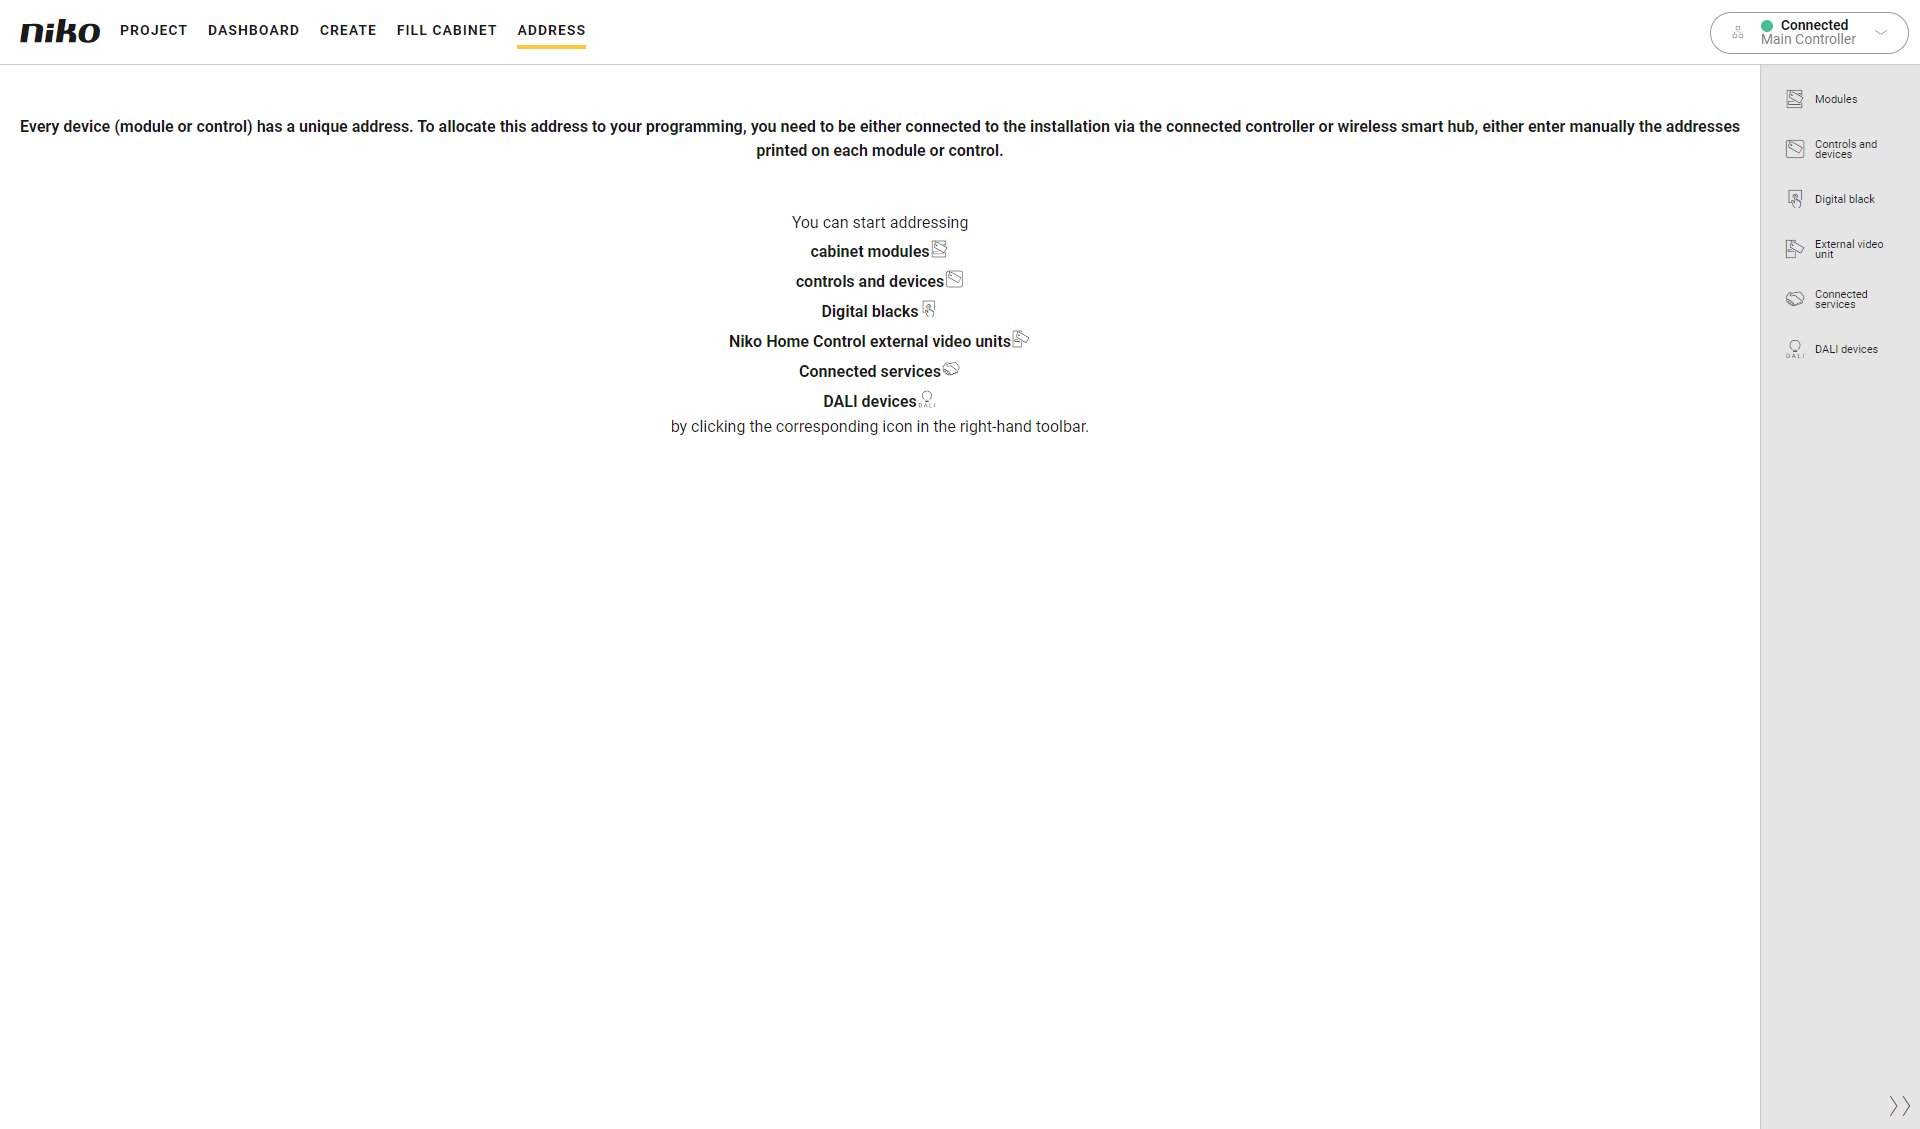
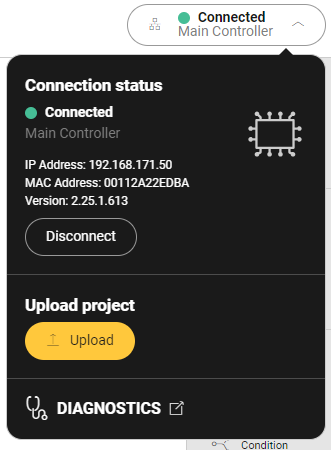
In the right-hand side of the menu, click the Connection centre button.
Result:
Depending on your type of installation, the Dashboard tab or the Wireless smart hub setup tab opens.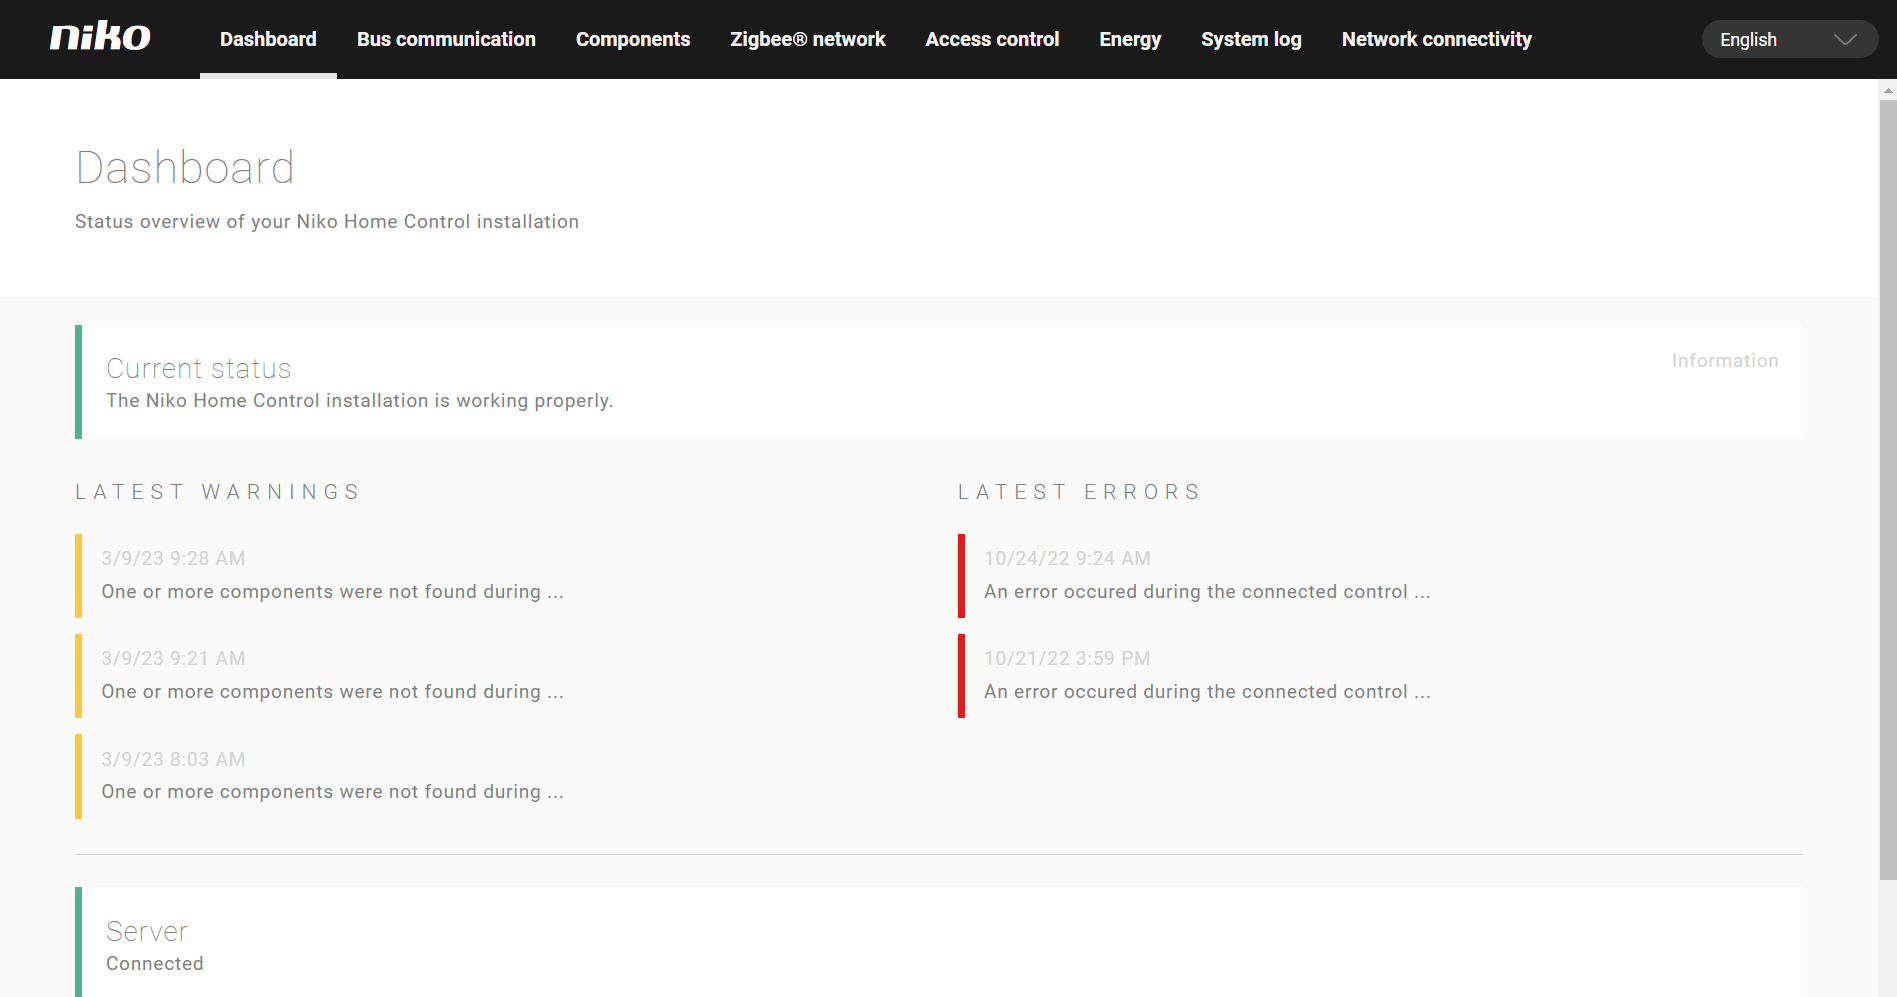
-
Select the desired tab.
You can select the following tabs:-
For an installation with a connected controller:
-
Dashboard: to view the current status, warnings and errors
-
Bus communication: to view messages from the Niko Home Control bus
-
Components: to view the status of components
-
Zigbee network: to view the status of your Zigbee network and devices, reset the Zigbee network, identify and remove devices
-
Access control: to export your access control data
-
Energy: to view the status of your solar panel inverter and/or your digital meter and export your energy data
-
System Log: to view the status of the installation
-
-
For an installation with a wireless smart hub:
-
Wireless smart hub setup: to connect your wireless smart hub to a Wi-Fi network
-
Zigbee network: to view the status of your ZigBee network and devices, reset the Zigbee network, identify and remove devices
-
Access control: to export your access control data
-
Energy (diagnostics): to view the status of your solar panel inverter and/or your digital meter
-
-
In the drop-down list select another language to change the language of the Diagnostics page.